How I built a ferry-route schematic from a Google Maps screenshot. Or: why you don't need a designer in 2026 anymore


In the TTSL Ferries post I promised to add a visual map of the lines — which terminal sits where, where the routes overlap. Done. Here's how, exactly: an unexpectedly easy pipeline of a Google Maps screenshot, Nano Banana, an online vectorizer, Claude Code, and a small editor that I'll embed right into this post below — you'll be able to drag the points and curves yourself. And no designer was involved at any step.
Step 1: screenshot and Nano Banana
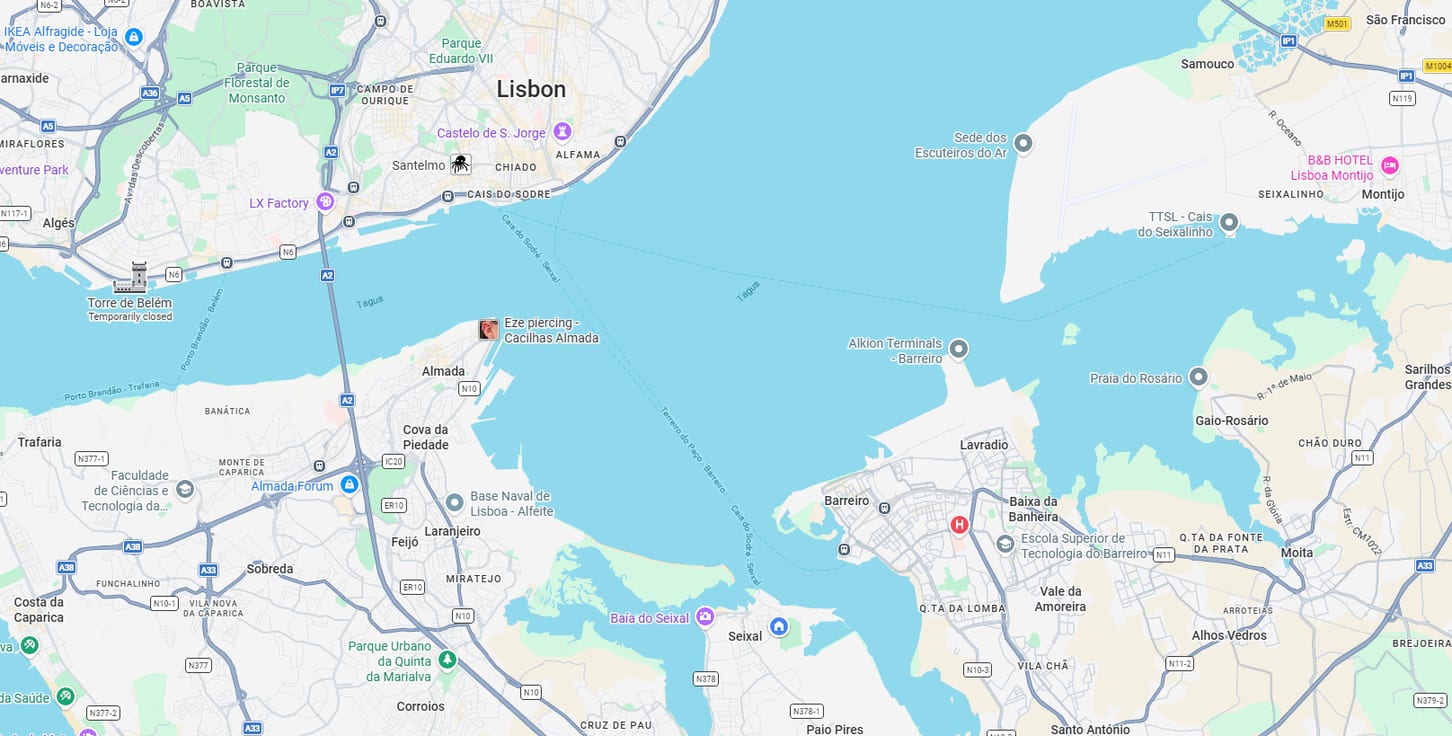
I took a screenshot of the Tejo estuary on Google Maps: Lisbon, Almada, Barreiro, Montijo. That's enough — the diagram doesn't need to be a precise map, it just needs the shoreline shapes and terminal positions to roughly match reality, which Google Maps gives you for free.
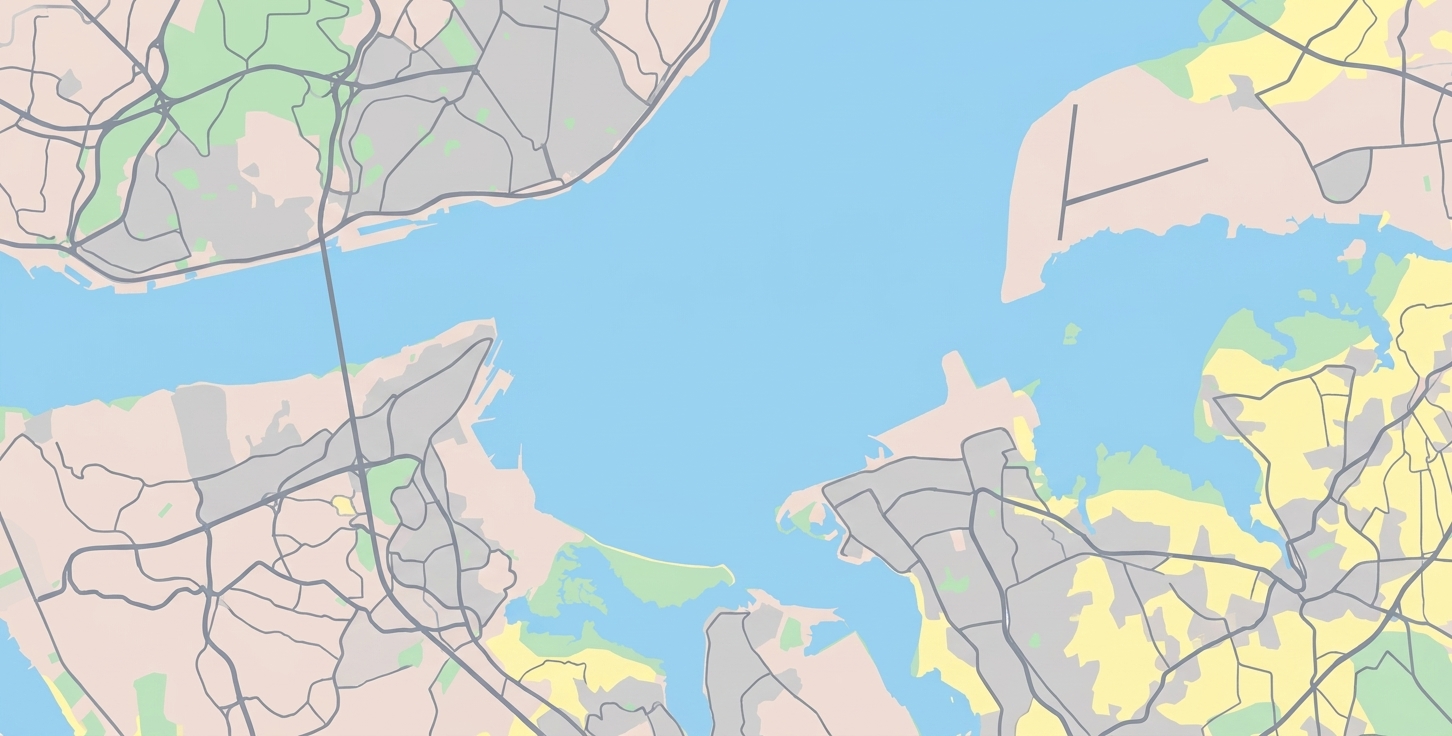
Then I handed the picture to Nano Banana and asked it to strip every label — neighborhood names, streets, stations, all of it. Out came a clean "diagram": water, coastline, leftover urban texture, but no text.
Step 2: raster to SVG
You can't really do much with a raster image. You can't scale it without losing quality across different screens — and I have iPhone, Android, and various resolutions to support. You can't overlay interactive elements — points, lines, tappable areas — without a separate geometric layer. I needed a universal format that works on any device and that I can draw things on top of. SVG is the obvious pick.
I ran the picture through one of the free online raster-to-vector services (search for "SVG 2 PNG"). It did a surprisingly clean job: high quality, no artifacts. The output is a real vector that scales to any size without blurring. The SVG file contained everything from the source: coastline, water fill, roads, building blocks — every geometric object from the screenshot turned into honest <path> elements.

Step 3: keep only water and coastline
I handed the file to Claude Code and asked it to keep only the water and the coastline, delete everything else. This is the kind of task SVG is perfect for: text XML, clear structure, you can walk the <path> and <polygon> elements and drop whatever you don't want. A couple of iterations later I had a clean diagram of the estuary — water, shoreline, nothing else.

Step 4: terminal points
Next I asked Claude to drop terminal points onto the map at their real coordinates — Cais do Sodré, Terreiro do Paço, Cacilhas, Seixal, Barreiro, Montijo, Trafaria, Porto Brandão, Belém. Claude pulled the coordinates from open sources and converted them into SVG coordinates.
Naturally, they didn't land where they should have. Some ended up in the water, some deep on land, some near but not on the shore:

I didn't bother with proper georeferencing — I just went down the list saying "move that one up a bit," "this one a couple pixels left," "that one lower and to the right." Took ten minutes and was faster than setting up a proper projection. If the goal is a diagram, not a map, this approach is perfectly fine.

Step 5: route lines
Once the points were in place, I asked Claude to connect them with lines — origin and destination of each route. A few issues popped up:
- Some lines cut across land.
- Lines crossed each other.
- Curves landed in the wrong places.

Asking Claude every single time to nudge a Bézier control point was getting old. So I asked for something else.
Step 6: a small line editor
I asked Claude to whip up a separate HTML page — a simple editor where I could drag everything around with the mouse. Map on the left, route list on the right, each route with its own "Copy" button next to a ready <path>, plus a global "Copy all paths." On the map itself: big dots are anchors (line endpoints and intermediate points), small squares are Bézier control points. Drag with the mouse and the line recomputes in real time.
This turned out to be way more pleasant than typing "move the Cacilhas–Cais do Sodré control point eight pixels up" to Claude. I opened the page, pulled the points around, watched how lines settled on the water and where they crossed, fixed it. About five minutes later the diagram was in a state where every route runs over water, none of them touch land, and the only crossings left are the ones I'm fine with:
Once it all clicked, I copied the finished <path> elements via that same "Copy all paths" and committed them to the production SVG. The editor itself stayed as a separate page in the repo — useful next time Transtejo opens a new route or moves a terminal.
By the way — here's that same editor right inside this post. You can drag the points and curves yourself and feel for yourself how much nicer it is than dictating coordinates by text:
Step 7: dark theme
The image above already adapts to the current site theme — toggle the theme in the header and the diagram repaints. The same thing happens in the app: light theme shows the light map, dark theme shows the dark one.
How it ended up
The diagram lives on its own screen in the app — fullscreen, with pinch-to-zoom, pan, rotate, and tap-on-terminal opens Google Maps directions to that pier. Download for Android / download for iOS.
Takeaway
One. These days, for any narrow one-off task — clean an SVG, scatter some points, tweak a few curves — you can throw together exactly the tool you need in three minutes, without reinventing the wheel and without hunting for a "universal solution."
We live in interesting times, folks...